The Anatomy of Benchmarking
21 May 2021
As a trusted partner to the automotive industry for 40 years, we know the importance of keeping a close eye on trends and distinguishing wheat from chaff. One golden trend that we have invested our time and resources in is electric vehicles. We have partnered with FEV Consulting, to undertake a holistic benchmarking analysis of electric vehicles and to group the competencies necessary.
Within this cooperation, various electric vehicles are subjected to a design, function, and cost benchmarking every year and we are currently analyzing Volkswagen’s first purely electric designed car: the VW ID.3. In the case of the VW ID.3, the benchmark results are already completely available by analyzing four vehicles in parallel.
But let’s take a quick step back and tackle the world of benchmarking.
Defining Benchmarking
Benchmarking is important today because it allows us to learn about new and innovative technologies, gain insights into competitor products and understand their cost structure, generate new design and product ideas, receive neutral technology assessments, and lastly to be able to define target costs and identify cost reduction ideas.
Below is an image showcasing the phases of the benchmarking process:
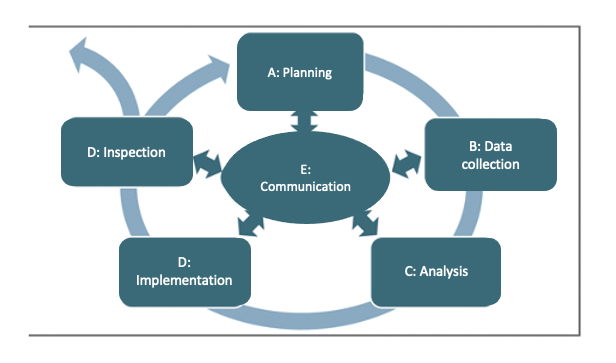
Based on the benchmarking phases, a categorical distinction is made between design, function, and cost benchmarking. Additionally, the benchmarking activities are divided into bilateral and cooperative sections. Bilateral refers to explicit commissioning of the respective benchmarking by a customer who uses the results exclusively, while cooperative refers to us making advance payments with certain benchmarking activities and offering the results to an interested customer consortium.
Cost-sharing is the main idea behind cooperative benchmarking. In principle, market-relevant vehicles or components are analyzed in numerous companies (OEMs and also Tier 1 to Tier x suppliers) at the same time or in parallel. In general, however, these benchmarking activities are very time-consuming and costly. For market-relevant systems, we offer customers an alternative to streamline internal processes, shorten processing times, and also accelerate the path to innovative products. Against this background, we collect the results while the customers share the results and also the costs.
Benchmarking with fka, Example Energy Efficiency
As mentioned, benchmarking is a comparative analysis but why take these measurements, to begin with? With the continuous benchmarking of new series vehicles, we always record the latest state-of-the-art technology. By using controlled measurement conditions and tests, we enable a comparison of different vehicles. This enables our customers to measure themselves against the competition and uncover possible relevant innovations.
We measure the efficiency of the drive train, which means we compare the amount of energy on the wheels with the amount of energy on the drive battery. The conversion between electrical and mechanical energy is lossy. We measure these losses and can then make a statement about the efficiency of the electrical machine and the associated converter. We measure this efficiency in different driving situations in order to understand the behavior of the vehicle and the components more precisely. In addition to the amount of the losses, we are also interested in the vehicle's operating strategy, i.e. how the losses are dealt with. This means that we have to measure the vehicle's thermal behavior. Even before the vehicle arrives, we use the literature to get an overview of the technical specifications and try to make the best possible pre-selection of our measurement technology.
As soon as the vehicle is on our grounds, we compare this information with the real conditions. We dismantle cladding parts and reveal the possible measurement positions. This is then measured and the manufacturing of adapters begins in order to be able to connect our data acquisition technology to the present vehicle. As mentioned at the beginning, we record the drive power on the wheels. For this, we need a connection to the wheel hubs with our measuring technology. To record the mechanical performance, we measure the speed and torque. To determine electrical power, we need to record the current and voltage.
To do this, we install the appropriate taps in the connecting cables between the battery and the drive unit, consisting of the converter and the electrical machine. We determine the thermal behavior with the help of the hydraulic system by measuring the flow rate, the pressure, and the temperature of the cooling medium. To obtain a statement on the thermal behavior of the drive unit and battery components, the variables mentioned are measured in front of and behind the component. In addition to this external sensor system, we also try to access the sensor values of the vehicle in order to benefit from the internal diagnosis. The first experiment we carry out is driving out the efficiency maps. These provide information about the power loss as a function of torque and speed. Representative constant speeds are set and the accelerator pedal position is varied in small steps for three different HV battery voltages.
In the next step, we take measurements again with the accelerator pedal in maximum position and record the resulting power on the battery and the wheel hubs. After a while, the vehicle reduces the power from the maximum to the continuous power in order to protect the drive train from damage, for example, due to the warming caused by the losses. The point in time and the amount of this reduction varies between different vehicles and is often used as a benchmark. In addition, we examine the drive, the recuperation behavior, i.e. energy recovery. For this purpose, electric vehicles usually have different modes that can be selected by the driver. The design of this is also a frequently chosen comparison variable for different vehicles.
With the driving resistance simulation, we examine the thermal behavior of the vehicle. The constant speeds are approached and maintained again. The accelerator pedal position now results from the driving resistances. This state is maintained until the temperatures in the cooling system no longer change. The operating strategy of thermal management can be deduced from the measured flow rates and temperatures. The measurements are rounded off with an examination of the dynamic vehicle behavior. The vehicle follows the speed curve of the WLTC test cycle. This allows conclusions to be drawn about the energy requirements of the vehicle and the dynamic behavior of the operating strategy.
The measurement data is initially available in a raw format of the measurement technology used. The signals contained are first synchronized, converted, and then suitably combined and processed. For the constant operating points, the measurement data are averaged and converted into maps or characteristic curves. This is how the efficiency maps and recuperation characteristics are created. The measurements of the time behavior, for example for power reduction, constant drives, and WLTC, are displayed as time series and the behavior is interpreted as appropriately as possible.
Finally, we extract additional meta-information resulting from the measurements. This includes, for example, the battery behavior for different states of charge or the pressure loss characteristic for different coolant flows. All results are documented in a final report. For each experiment, there is a description of the process and a summary of the results. In addition, information on the experimental setup and the measurement technology is given. In addition, our customers also receive the processed measurement data in order to be able to carry out their own analyzes or we can carry them out on request.
Benchmarking, Current Status, and Next Steps
Currently, the Tesla Model 3 and VW ID.3 have already been analyzed as part of the cooperation with FEV. Together we are continually expanding this database for our customers. In addition, we are working intensively on adapting the analysis content to current needs and technologies, e.g. on the subject of battery systems. Data and knowledge management is also an important topic.
Within the benchmarking, we differentiate between 5 modules that are checked and made available to the customer either separately or in total.
Modules 1 to 4 focus on function benchmarking. In detail these are:
- Module 1: MICRO BENCHMARK
- Module 2: ADAS FUNCTIONS
- Module 3: VEHICLE DYNAMICS & ACOUSTICS / NVH
- Module 4: DRIVETRAIN & E / E
In module 1, a summary of vehicle specifications, based on publicly available data is given. The module contains a comprehensive vehicle overview and photo documentation. In addition to that, on-road cycle simulations are conducted regarding NEDC, FTP75 and RDE. Charging tests as well as initial performance and energy consumption tests are also given. With this mandatory module, a comprehensive overview of the vehicle performance is given without providing detailed measurement data, but subjective data collection.
Module 2 deals with the analysis of the ADAS performance of the vehicle. In doing so, the performances of the Automatic Distance Control (ACC), Lane Keeping Assistant (LKA), Lane Change Assistant (LCA) as well as parking Assistant (PA) are identified by using measurement technique in the reference vehicle as well as in the comparison vehicles. The positions of the different vehicles are determined by GPS positioning and the CAN-data is logged.
Module 3 concentrates on vehicle dynamics and Acoustics/NVH. Several driving tests are performed (e.g. steady-state cornering, step steer, sinusoidal steer, and VDA lane change, etc.) and several driving parameters (e.g. vehicle velocity, steering wheel angle, steering wheel torque, yaw rate, lateral acceleration, slip angle, etc.) are measured. In addition to the driving tests, the inertia parameter is determined (total mass, cog in x/y/z, mass moments of inertia) on the VIMM (Vehicle Inertia Measurement Machine). A k&c analysis is also part of the Module. Regarding acoustics, a subjective evaluation is conducted and several driving operations measurements are done. In addition to that, airborne noise and structure-borne transfer functions are given and exterior noise measurements regarding ECE R138 are done.
Module 4 deals with the analysis of the drivetrain, thermal management as well as electrical and electronic (E/E). Within the drivetrain study, the vehicle energy management (cycle electric range/electric energy consumption at multiple temperatures, real life cycle electric range/electric energy consumption, HV charge analysis at multiple temperatures), the control strategy (control/operation strategy analysis based on chassis dyno tests and real-world, critical mission tests) and the efficiency of the electric drive are determined. Within the thermal management analysis, the thermal and hydraulic power of all cooling circuits and their components are analyzed and documented at constant vehicle speed. In the E/E-analysis several stability and function tests are done (e.g. full-throttle acceleration tests at different states of charge, execution of real driving cycles at different systems on a chip (SoC), parking process, coast, and brake tests at different SoC). The 12V board net energy management as well as the direct current to direct current (DC/DC) control strategy is analyzed. Standby current measurements (key-off-shutdown-measurement for shutdown characteristics and standby current), full measurements of HV charging processes, and HV main power supply functions are also part of the program.
Module 5 deals with a complete vehicle breakdown to analyze design details and the general layout of the vehicle. The electro-specific systems and components are analyzed at the lowest detail level. All the different housings of the electro-specific components are optically scanned and partly transferred to CAD and FE-models (e.g. The HV battery housing).
In the teardown, we already gained our first interesting insights into the new Volkswagen platform for electric vehicles (MEB modular electrical construction kit). Volkswagen has created a very slim and structured design here with a focus on mass production and cost-efficiency.
The number of components, e.g. in the HV battery, has been significantly reduced. The cooling plate forms the bottom of the battery and is part of the battery structure. The battery modules can be equipped with pouch cells and prismatic cells in the same layout. There are few screw connections, which reduces assembly time. This is also reflected, for example, in the completely welded charging module, which has to be completely replaced in the event of a defect.
This basic scope can be expanded through further analysis. For this purpose, the fka & FEV-team is in lively customer contact and checks the corresponding requirements for individual measurements. In addition, customers can place bilateral additional projects in order to have their requirements checked as required or in an extended framework. Following the analysis, the vehicle can also be loaned for in-house tests.